Architecting Cloud Industrial IoT Workloads – Part 4: The Microsoft Azure Industrial IoT Platform
- November 22, 2022
This is the fourth post of our blog series on architecting cloud Industrial IoT (IIoT) workloads. Our first post covered use cases and challenges, our second post discussed the Amazon Web Services (AWS) IIoT landscape and solutions and our third post went over an AWS IIoT reference implementation for equipment failure detection. In the following post we will cover the Microsoft Azure Industrial IoT use cases and reference architecture.
Use Case: Condition Monitoring and Proactive Reporting for Industrial IoT
Microsoft’s Azure Industrial IoT Platform provides a collection of integrated components to connect shop floors and industrial assets. The Unified Architecture from the OPC Foundation (also known as the OPC UA) is used to get telemetry data from devices. Once connected, it scans and discovers equipment, collects data and stores it in the cloud. We can then analyze and visualize it to improve productivity and efficiency.
The platform comes with a sample environment and IoT data simulator so that you can quickly understand its capability before connecting to your own environment. The sample “Wind Farm” uses various sensors like Industrial Electronic Temperature Sensor, Industrial Air Humidity Sensor, Industrial RFID Reader Sensor and PalThree to monitor the equipment, such as a Gear Box, Generator System, Pitch System, Safety System, Weather System and Yaw System. You can monitor parameters such as Outdoor Temperature, Active Power, Gearbox Oil Level, Grid Frequency, Grid Voltage Phase, Torque, Hydraulic Oil Pressure, Fire Alert and Nacelle Angle. Visualizing the data allows the operator to manually identify if there are any significant changes to the equipment state that may cause the equipment or device to break down. The IoT platform also provides options for alerting and taking proactive actions.
Azure IIoT Reference Architecture
The typical architecture is depicted below:
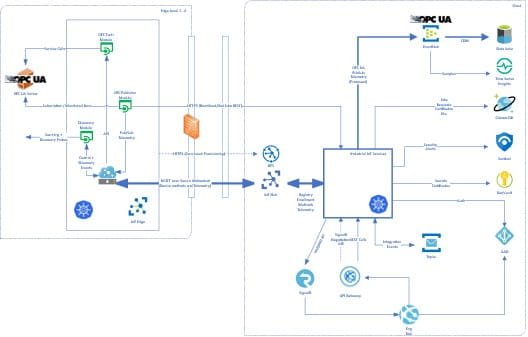
Image Source: Microsoft Learn on Github
Architecture Walkthrough
The Azure Time Series Insights explorer is used to construct the dashboard to monitor various equipment. You can also download and share the data in CSV format, PowerBI or as a table. The time range slider allows you to retrieve data for a specific time range.
The screen shot below shows various equipment monitoring for equipment status over a period of time.
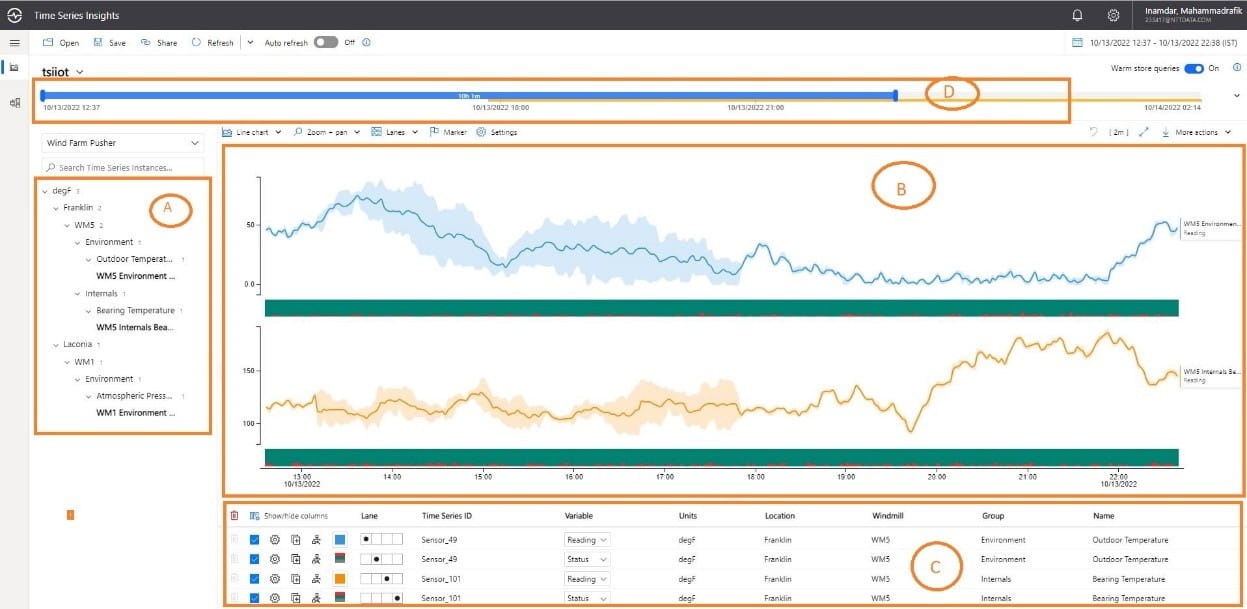
From the image above:
- Part A – Hierarchical module allowing comparisons to be drawn across time ranges and between sensor and device types
- Part B – Live chart showing sensor and device reading over time
- Part C – Categorical variable can determine how much time the elevator spent on the upper, lower and middle floors
- Part D – Time ranger slider to select duration between two times stamps
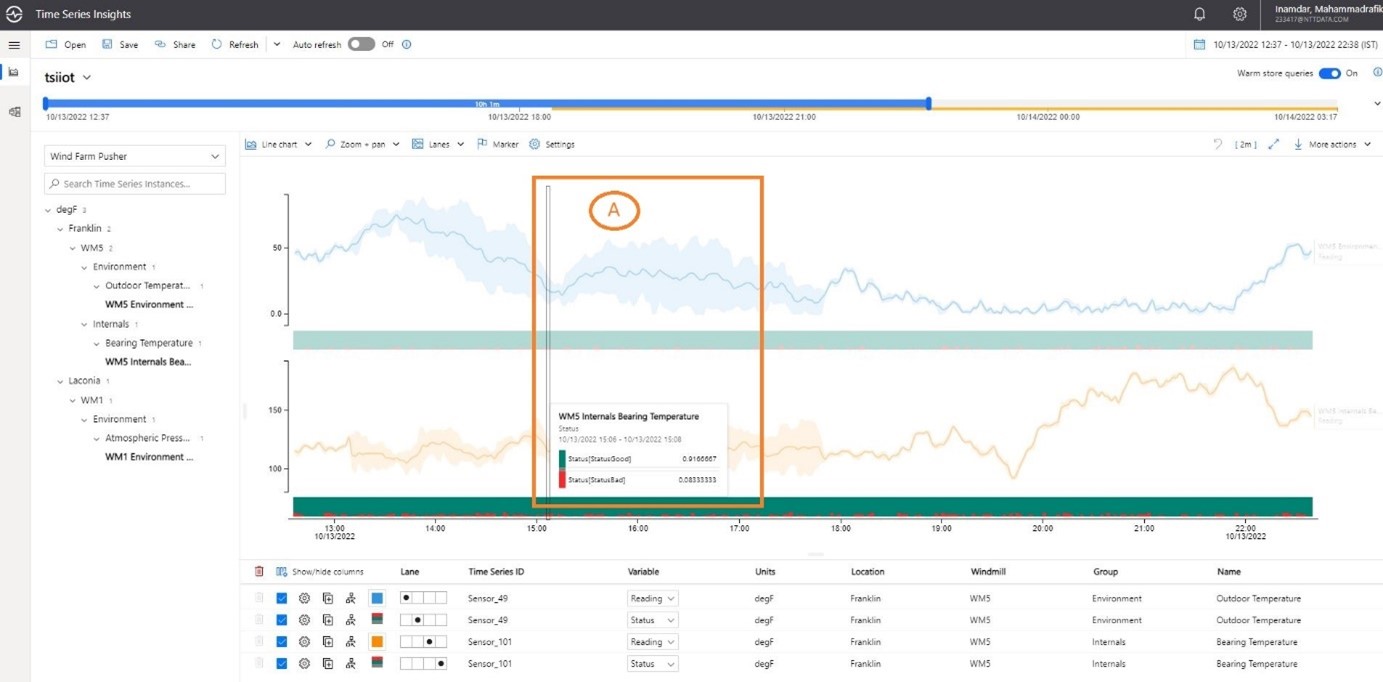
The following image shows use of the marker on a data point to see specific values at a given time and compare the multiple series (see part A).
The Azure Industrial IoT solution provides cost effective easily deployable solution. The cost will be incurred only for components like IoT Hub, storage, serverless compute and Ingress, and Egress. I hope you enjoyed learning a little about Azure Industrial IoT. Click on the links below to learn more:
Subscribe to our blog