


Cloud Services and Environmental Sustainability - Part 2: Measuring the Environmental Impact of IT Workloads
- June 20, 2022
In the first post of my 4 part-blog series about the cloud’s role in “green IT,” I talked about the importance of developing a sustainability plan for your IT workloads. As mentioned in that post, technology represents nearly 2% of the 38 billion tons of carbon emissions. To get a better understanding of how IT is contributing to this global problem, we can begin measuring the carbon footprint. And the best way to do that with the cloud is by using built-in, cloud-native tools from your public cloud provider.
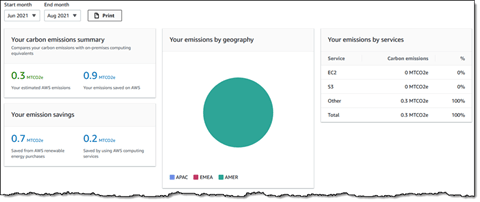
To start off, if you use AWS as your primary public cloud, then it can’t get easier than the AWS Customer Carbon Footprint Tool, which was announced at AWS re:Invent 2021. Officially released in February 2022, it provides information about workloads’ carbon emissions.
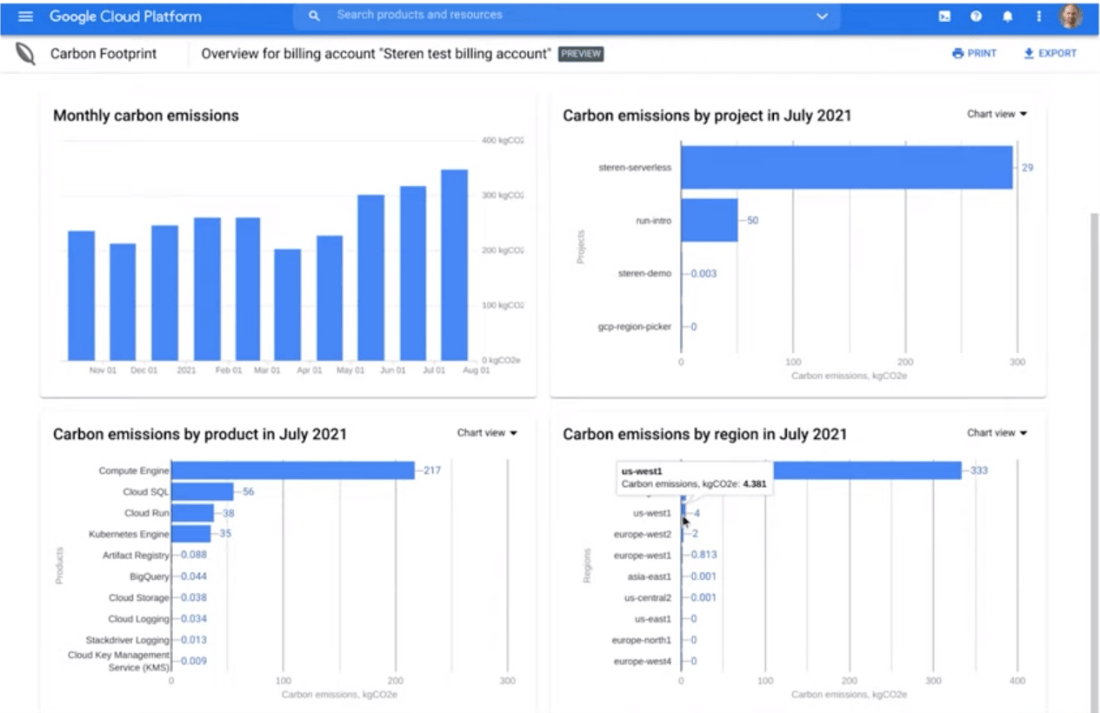
If you have workloads in Google Cloud Platform, then check out GCP’s free service for monitoring CO2 emission called Carbon Footprint. It’s located in the console, and data can also be exported for use with other tools.
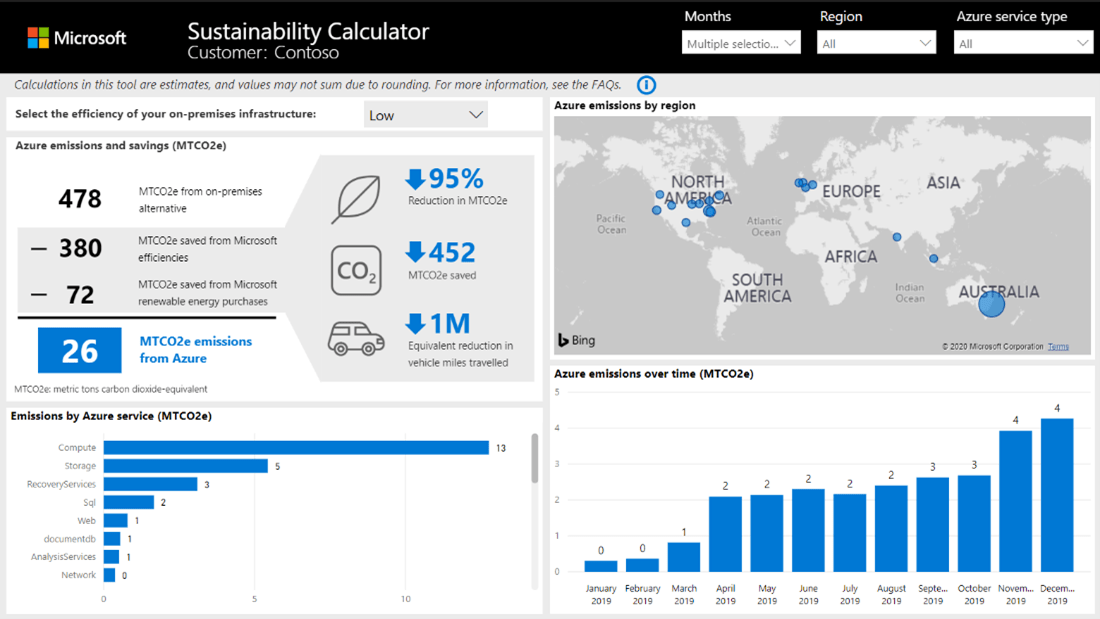
Or if you have workloads in Microsoft Azure, you should look into the Microsoft Sustainability Calculator, which is a Power BI app. Here’s a great blog post Microsoft published back when it launched in 2020.
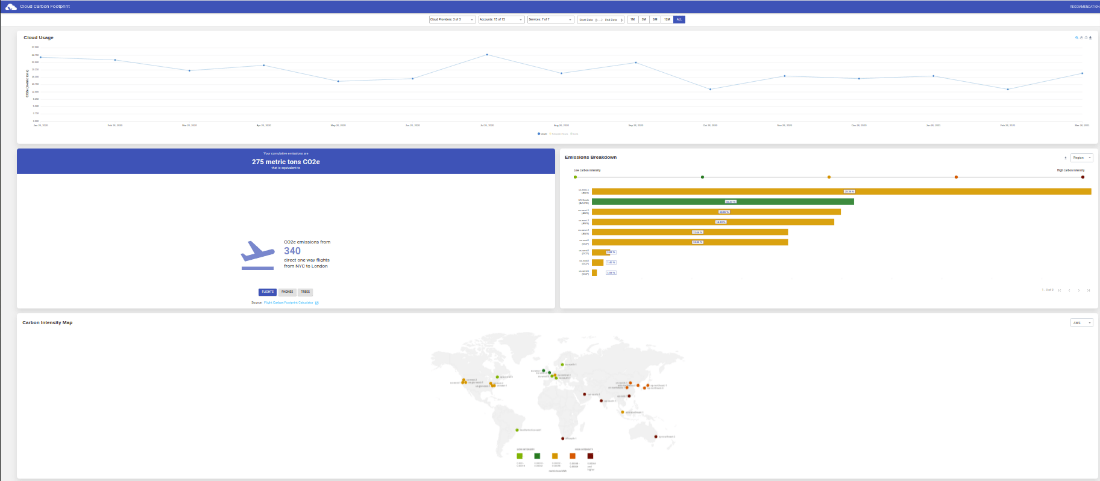
Lastly, if you prefer open-source tools, then the Cloud Carbon Footprint has the advantage of being cloud neutral.
While these tools are easy to use, it’s valuable to understand how the findings are calculated. CloudCarbonFootprint.org provides a detailed explanation. Following is its summary of the formula used to calculate emissions.
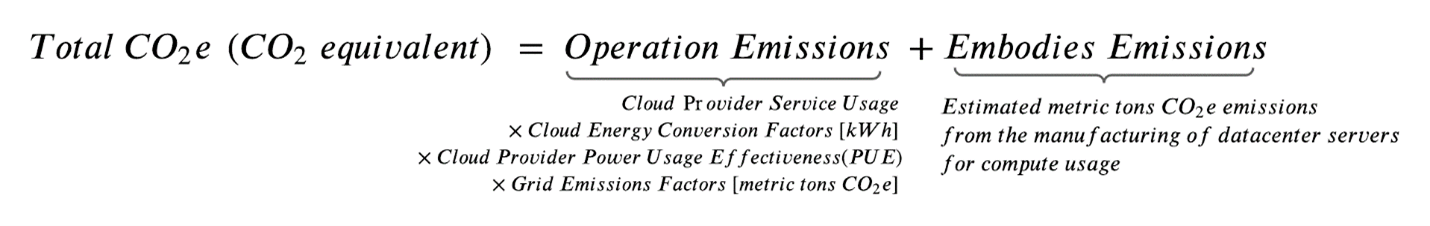
Here’s an easy-to-understand definition list for the Cloud Carbon Footprint equation:
- Cloud Service Provider Usage – The amount of time that cloud resources are used (compute, storage, networking). Data can be obtained from billing reports or usage APIs (Application Programming Interfaces), such as Amazon CloudWatch and AWS Cost Explorer.
- Cloud Energy Conversion Factors – Represents energy consumed by cloud resources. Factors are different for each type of resource, such as Amazon Elastic Compute Cloud (Amazon EC2), AWS Lambda, and storage. The unit for this variable in the equation is Watt.
- Cloud Provider Power Usage Effectiveness – The cloud provider PUE indicates the efficiency of a cloud provider’s energy use. A PUE of 1 means all energy used is for computing with no wasted energy. The goal is to get as close to 1 as reasonably possible.
- Grid Emissions Factors – Lists the type of local energy sources cloud regions use to power infrastructures. Sources include coal, nuclear, wind, gas, solar, and others. Each region produces a different amount of CO2 for each kWh generated. The unit for this variable is gCO2eq/kWh – gram of CO2 equivalent for each kWh.
- Embodied Emissions – Represents the additional emissions generated by the manufacturing and disposal of cloud resources. An application using resources for extended periods will represent a small fraction of the total carbon emissions. In cloud environments where resources can be shared, emissions are lower than in on-premise environments where resources are dedicated; the CO2 is already emitted, whether or not resources are used.
Your ability to change these variables depends on where you are on your cloud journey. If you’ve already deployed applications using a given cloud provider and region, the easiest way to lower energy your carbon footprint is to modify the infrastructure and application architecture. If you haven’t selected a cloud provider and region, the PUE and Grid Emissions Factors are the variables to consider.
| Variable | Time of decision |
|---|---|
| Cloud Service Provider Usage | When designing infrastructure and application architecture |
| Cloud Energy Conversion Factors | When selecting compute, storage or networking cloud services e.g. (EC2 vs Lambda) |
| Cloud Provider Power Usage Effectiveness (PUE) | When selecting a cloud provider |
| Grid Emissions Factors (GEF) | When selecting a cloud provider region |
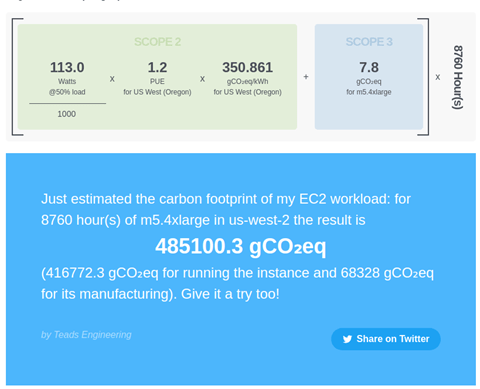
Teads Engineering hosts a simple calculator on their website that is great for visualizing the complex math previously listed. As you can see in the following image, this Amazon EC2 workload example (m5.4xlarge in us-west-2) running for one year (8,760 hours) will produce 485 kg of CO2 emissions.
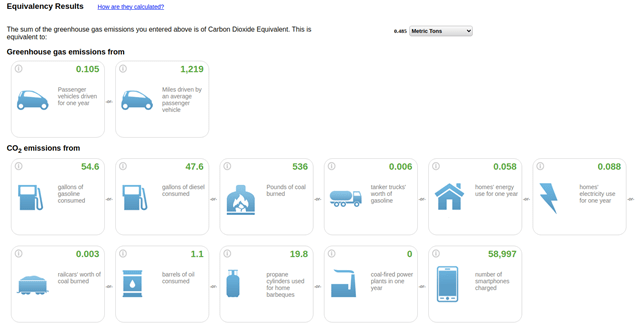
For comparative purposes, visit the calculator from epa.gov to learn what would generate the equivalent of 485 kg CO2 emissions, the amount of CO2 from this AWS workload. As illustrated below, it may tell you that the same emissions would be generated by driving 2000 km (1200 miles) in a car running at 22 MPG (miles per gallon):
Measuring our IT workloads is a great first step. It gives us a starting point. Then we can monitor the evolution of the monthly emissions. Advanced IT organizations will be able to forecast a workload’s emissions before it is even deployed and use this information as part of the architecture decisions. Read my next blog post to learn the five steps you can take to reduce your environmental impact from IT workloads.
Subscribe to our blog