


How To: Multi-Cluster Monitoring in Amazon EKS
- November 17, 2020
Prometheus integrated with Thanos provides a standard monitoring solution to capture metrics and discover any bottlenecks in Amazon EKS Clusters and applications running in and outside the cluster with an exporter. Prometheus provides a unified way of collecting and exposing metrics and Thanos allows us to create multiple instances of Prometheus, deduplicate data and long-term data archival solutions providing a highly available and scalable solution altogether and visualized on Grafana dashboard.
As teams grow and scale, it becomes extremely crucial from an operations perspective to set up centralized real-time multi-cluster monitoring in order to detect anomalies early and maintain high availability within and across clusters. The challenge arises as there is a need to extend the monitoring capabilities to clusters deployed across multiple AWS VPCs in production-grade environments. This is more challenging when these VPCs are non-connected.
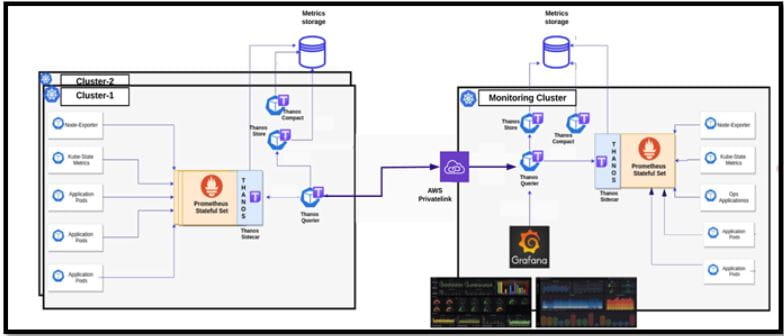
We can achieve centralized multi-cluster monitoring with the setup visualized above. While this allows us to monitor multiple EKS clusters from a single Grafana dashboard, the monitoring set up in each cluster will also allow us to view those metrics separately should the need arise by just deploying Grafana to the respective clusters.
Initial Setup
- Two or more EKS clusters with Prometheus-Thanos deployments that act as data-producers and expose metrics via Prometheus.
- Ensure unique external labels for all Prometheus deployments in order to filter and deduplicate data.
- One data-aggregator cluster which will aggregate data from the other clusters. This Cluster will also host Grafana for data visualization and reporting.
Steps to add target clusters:
- Thanos-Query component on the target data-producer clusters should be exposed with an ingress NLB. It allows us to aggregate and deduplicate multiple metrics backends under a single Prometheus Query endpoint.
- Create a PrivateLink for the NLB, allowing the AWS account where the Central-monitoring cluster resides.
- Create an Interface endpoint on the Central-monitoring cluster VPC.
- Update Thanos-Querier deployment in the Central-monitoring cluster to query metrics from the other cluster by adding the Interface endpoint obtained above as a source.
– –store=:10901
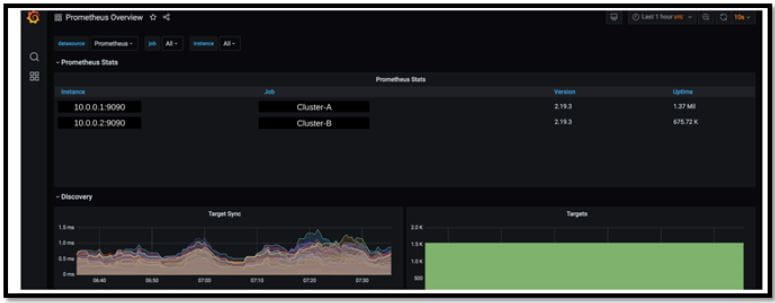
Once the Querier deployment is updated, added clusters should be available in Grafana dashboard.
Solution in Action
This summer we helped a manufacturing customer achieve this very solution. The team had multiple production environments that were disconnected for legal compliance reasons. While the isolated environments were not able to communicate with each other, the process to obtain and monitor system health was tedious at best. Operators would need to log into each system separately where they could find the operational data from each individual cluster. From here, there was yet another step to aggregate the data to determine system-wide health.
We replaced this cumbersome process with the solution described here. Now the customer has an elegant solution to monitor system-wide operational health. Here the team can track the health of its applications and can even customize the solution to meet their specific needs. The solution has saved the team from countless hours of mundane tasks – logging in, obtaining data and logging out of multiple environments – which can now be directed to more strategic, business-impacting work. To further optimize the team’s productivity, our next step is to add alerting capabilities to the solution.
Timely metrics for applications running in a cluster allow you to achieve greater insight into your application’s overall health and reliability. Yet, as the number of clusters grows, so does the complexity of the monitoring system. Use this EKS multi-cluster monitoring solution to gain greater visibility with less overhead.
Subscribe to our blog